
Hello, I'm
Yahia
Alghanam
Data & Analytics Engineer


Hello, I'm
Data & Analytics Engineer
Get To Know More
Detail-oriented Data Analyst and Analytics Engineer with strong expertise in SQL, Power BI, Python, ETL pipelines, and business intelligence solutions.
Experienced in data cleaning, data visualization, dashboard development, and extracting actionable insights to support strategic business decisions.
Passionate about transforming raw data into meaningful stories that drive growth and operational efficiency.
Explore My
Browse My Recent
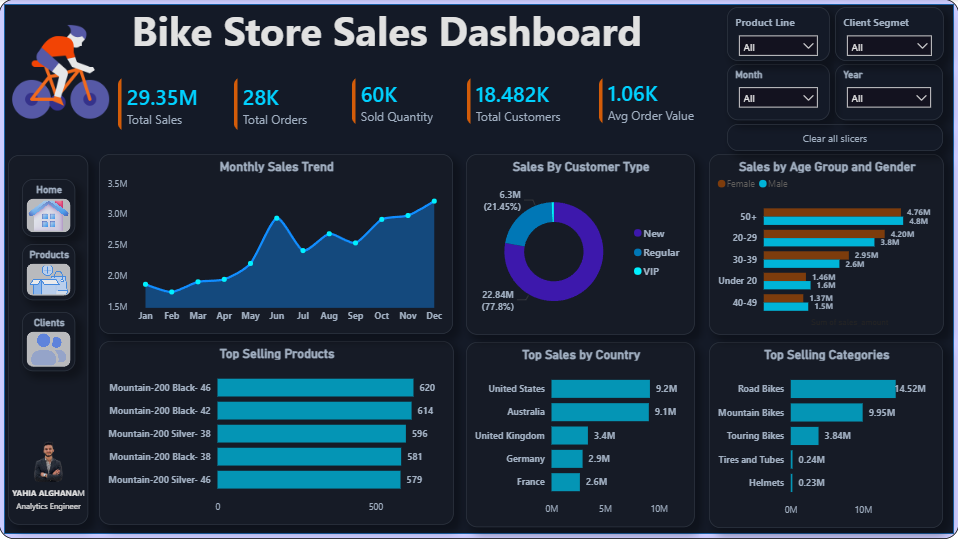

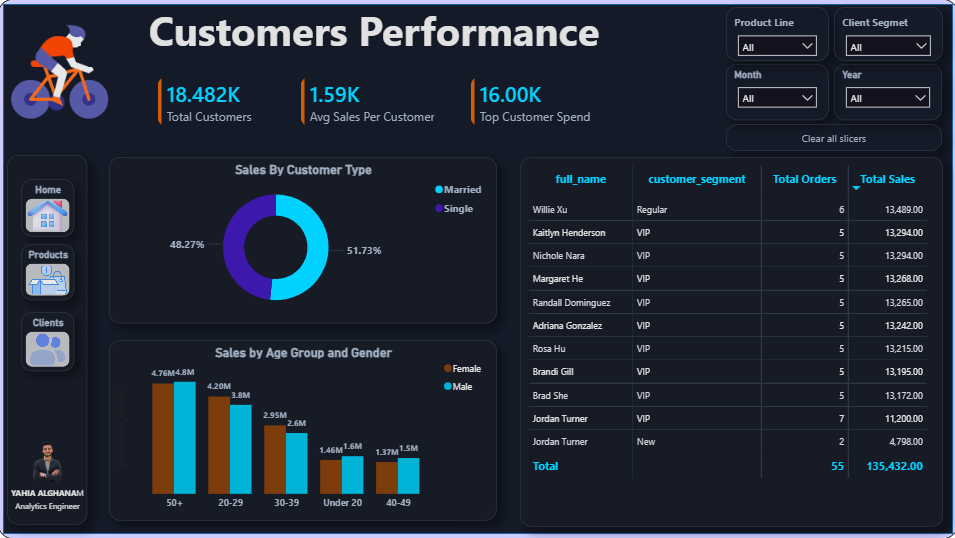
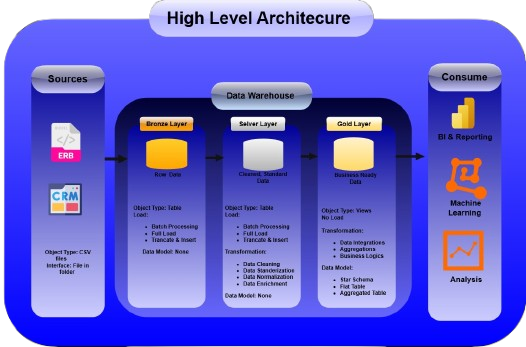
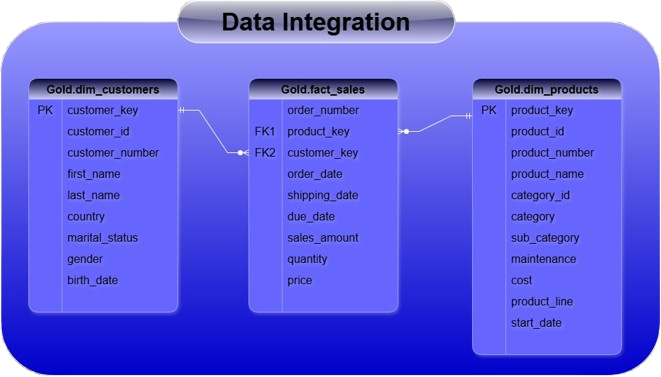
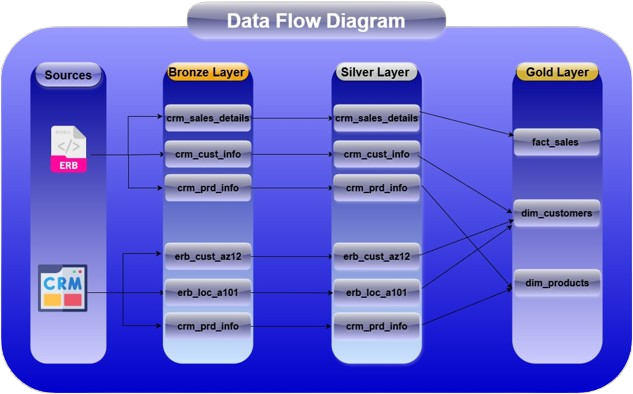

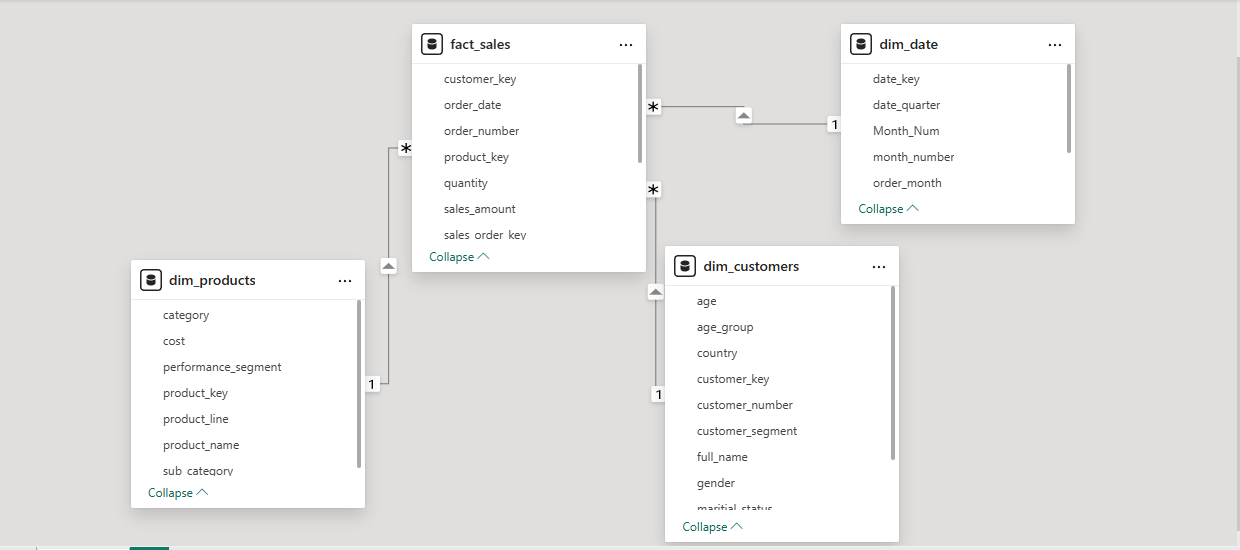
Developed an end-to-end retail DWH using a Medallion Architecture in SQL Server. Built a full-load ETL pipeline via stored procedures to ingest raw CRM/ERP data into Bronze, then applied deduplication, SCD Type 2 logic, and data cleansing to conform fields in Silver. Modeled a semantic Gold layer using a optimized Star Schema with customized customer/product segmentation marts. Powered executive Power BI dashboards tracking $29M+ in sales and VIP metrics.
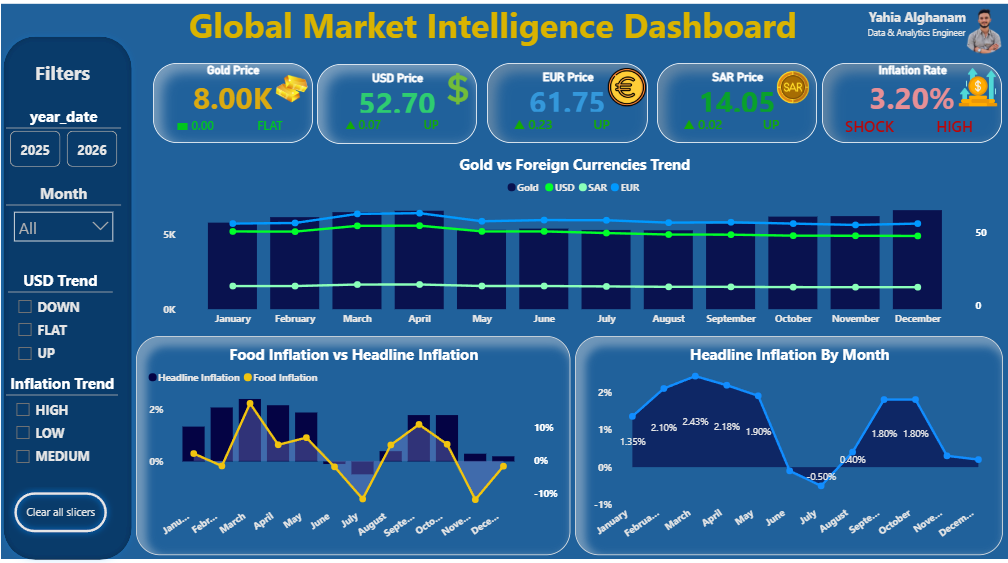
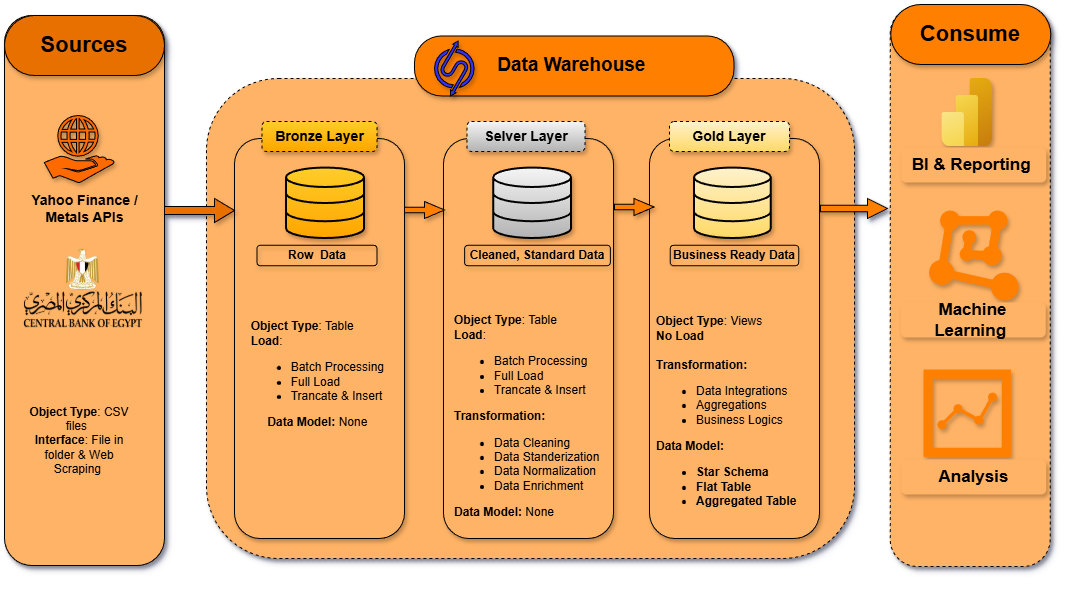
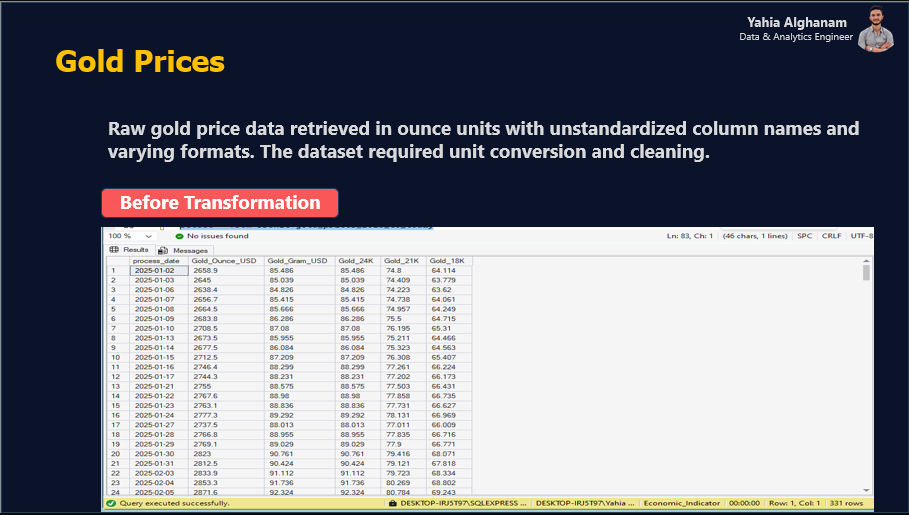
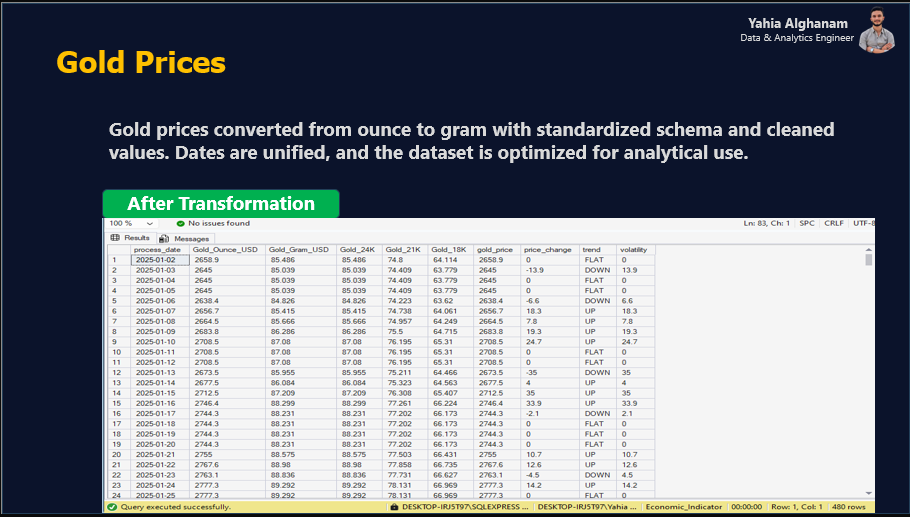
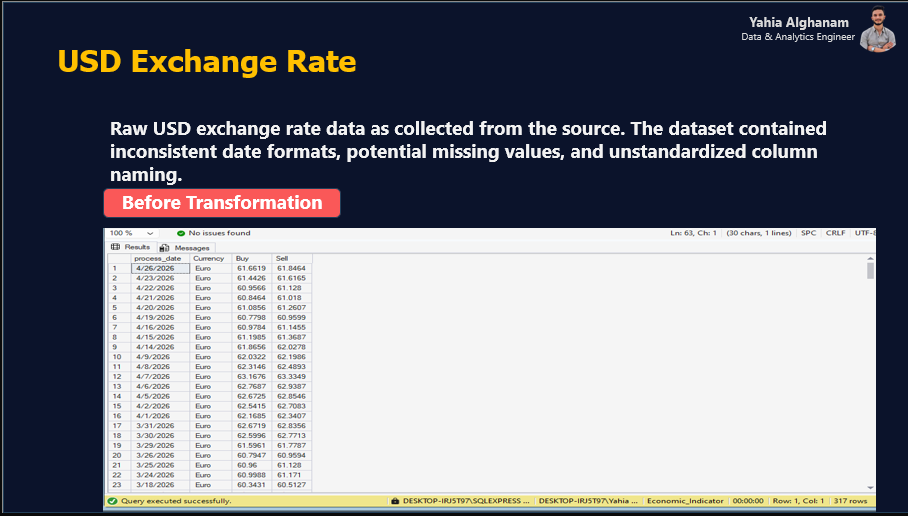
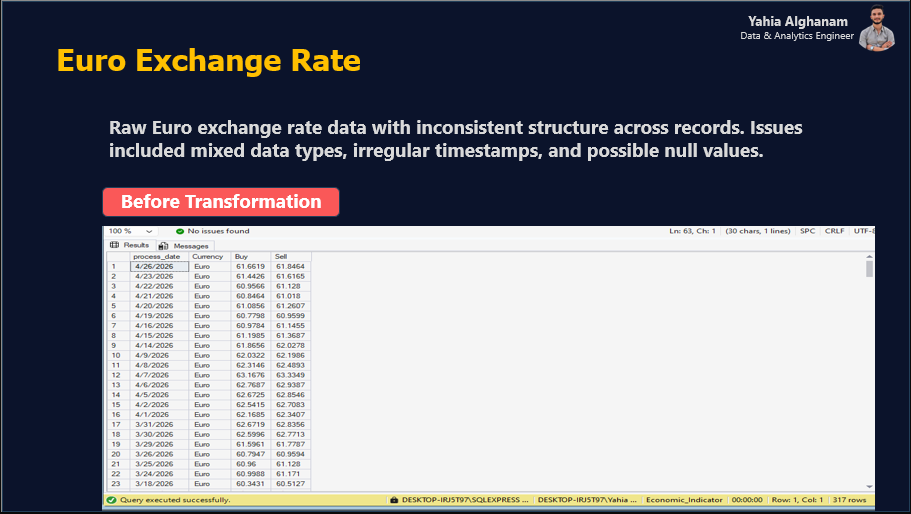
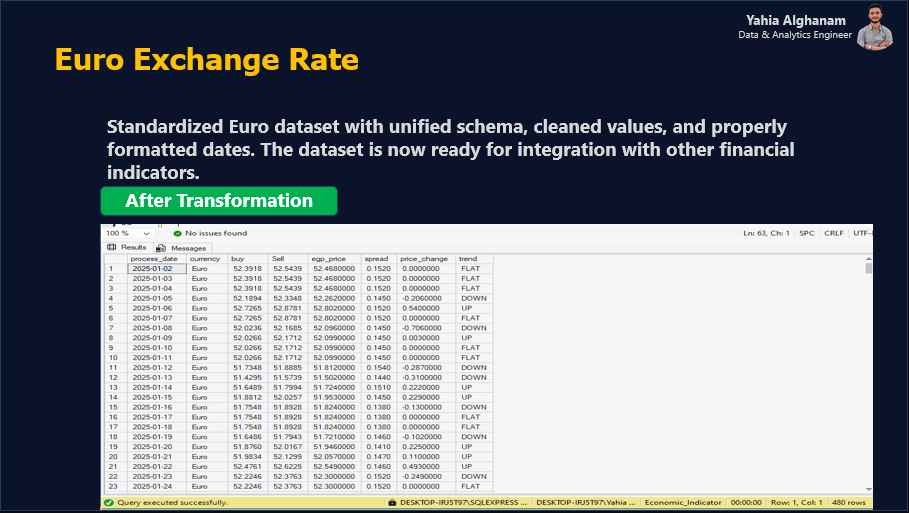
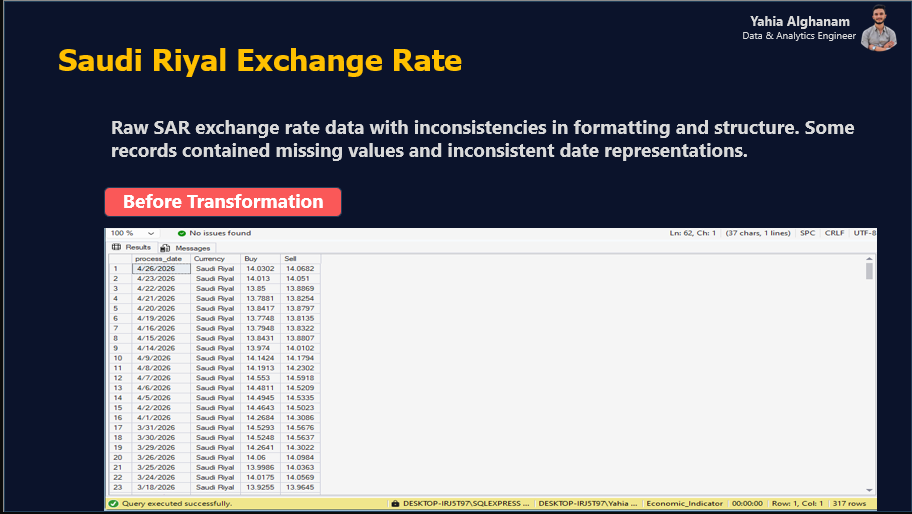
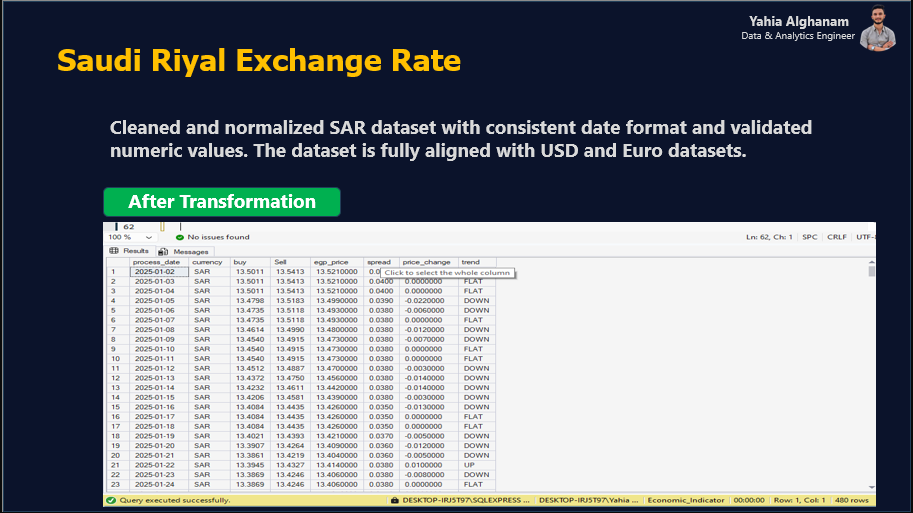
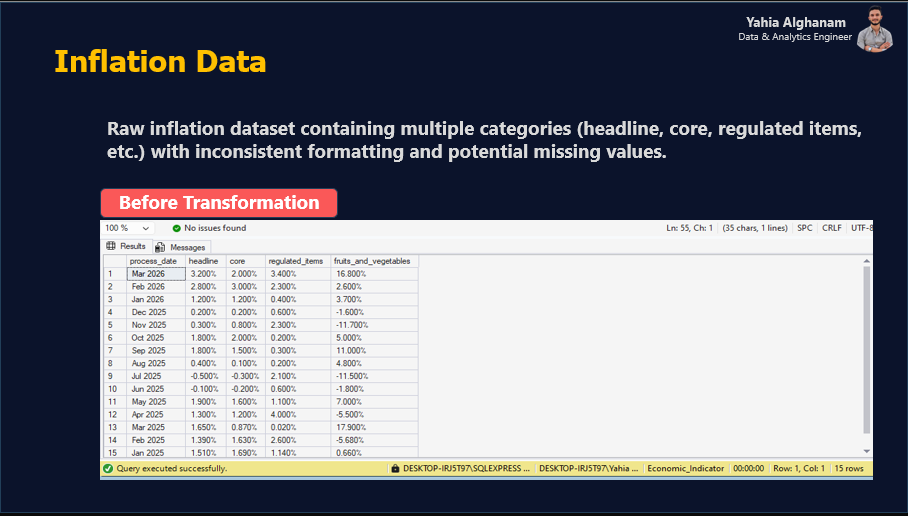
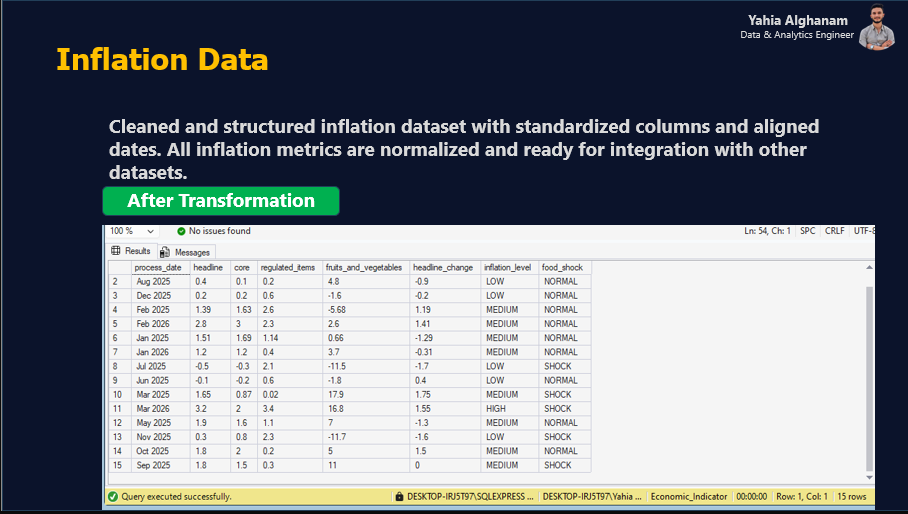
Built a high-performance macroeconomic analytics system delivering real-time insights into gold and currency market behavior for enterprise decision-making. Developed an end-to-end SQL Server pipeline using Medallion Architecture to transform raw financial data (Gold, USD, EUR, SAR) into a structured analytical layer. Implemented stored procedures to analyze volatility, inflation shocks, and currency trends.
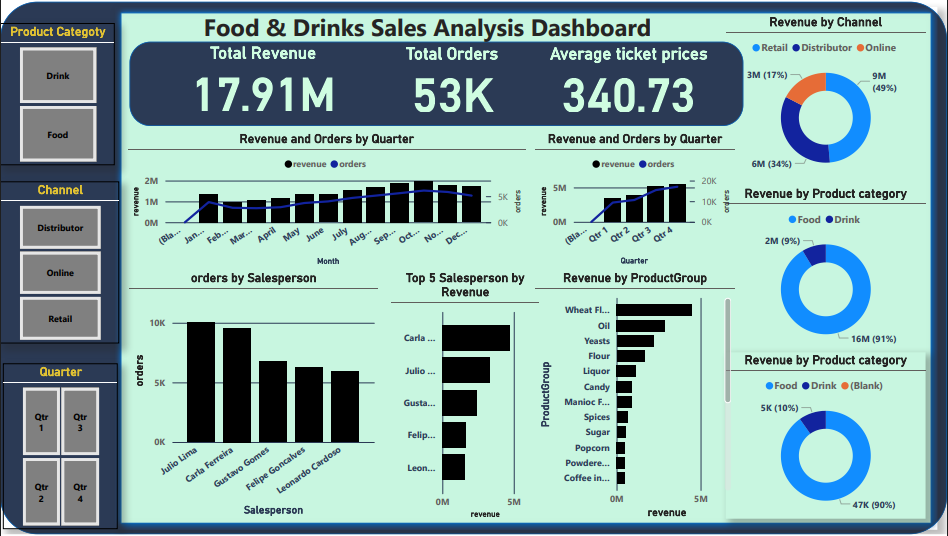
Developed an interactive Food & Drinks Sales Analysis Dashboard in Power BI delivering real-time insights into business performance and revenue trends. Built a solution tracking key KPIs including total revenue, orders, and average order value. Designed analysis across time, categories, channels, and salespersons. Implemented dynamic filtering and drill-down to explore customer behavior.
.png)
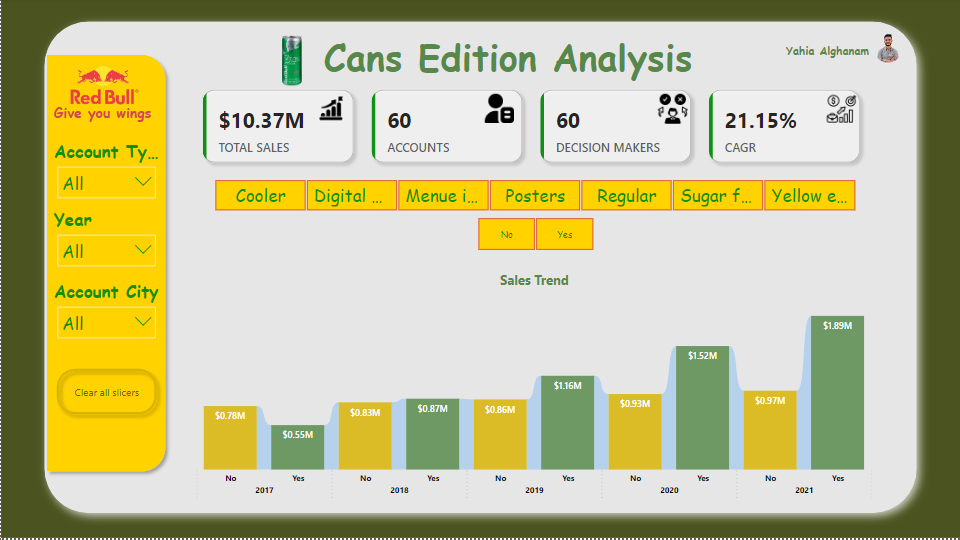
Red Bull Sales Analysis is an end-to-end data analytics project focused on transforming raw sales data into actionable business insights. It explores revenue trends, product performance, and account-level contributions across different customer segments. Includes data cleaning, modeling, KPI development, and exploratory analysis to identify growth patterns and key revenue drivers.
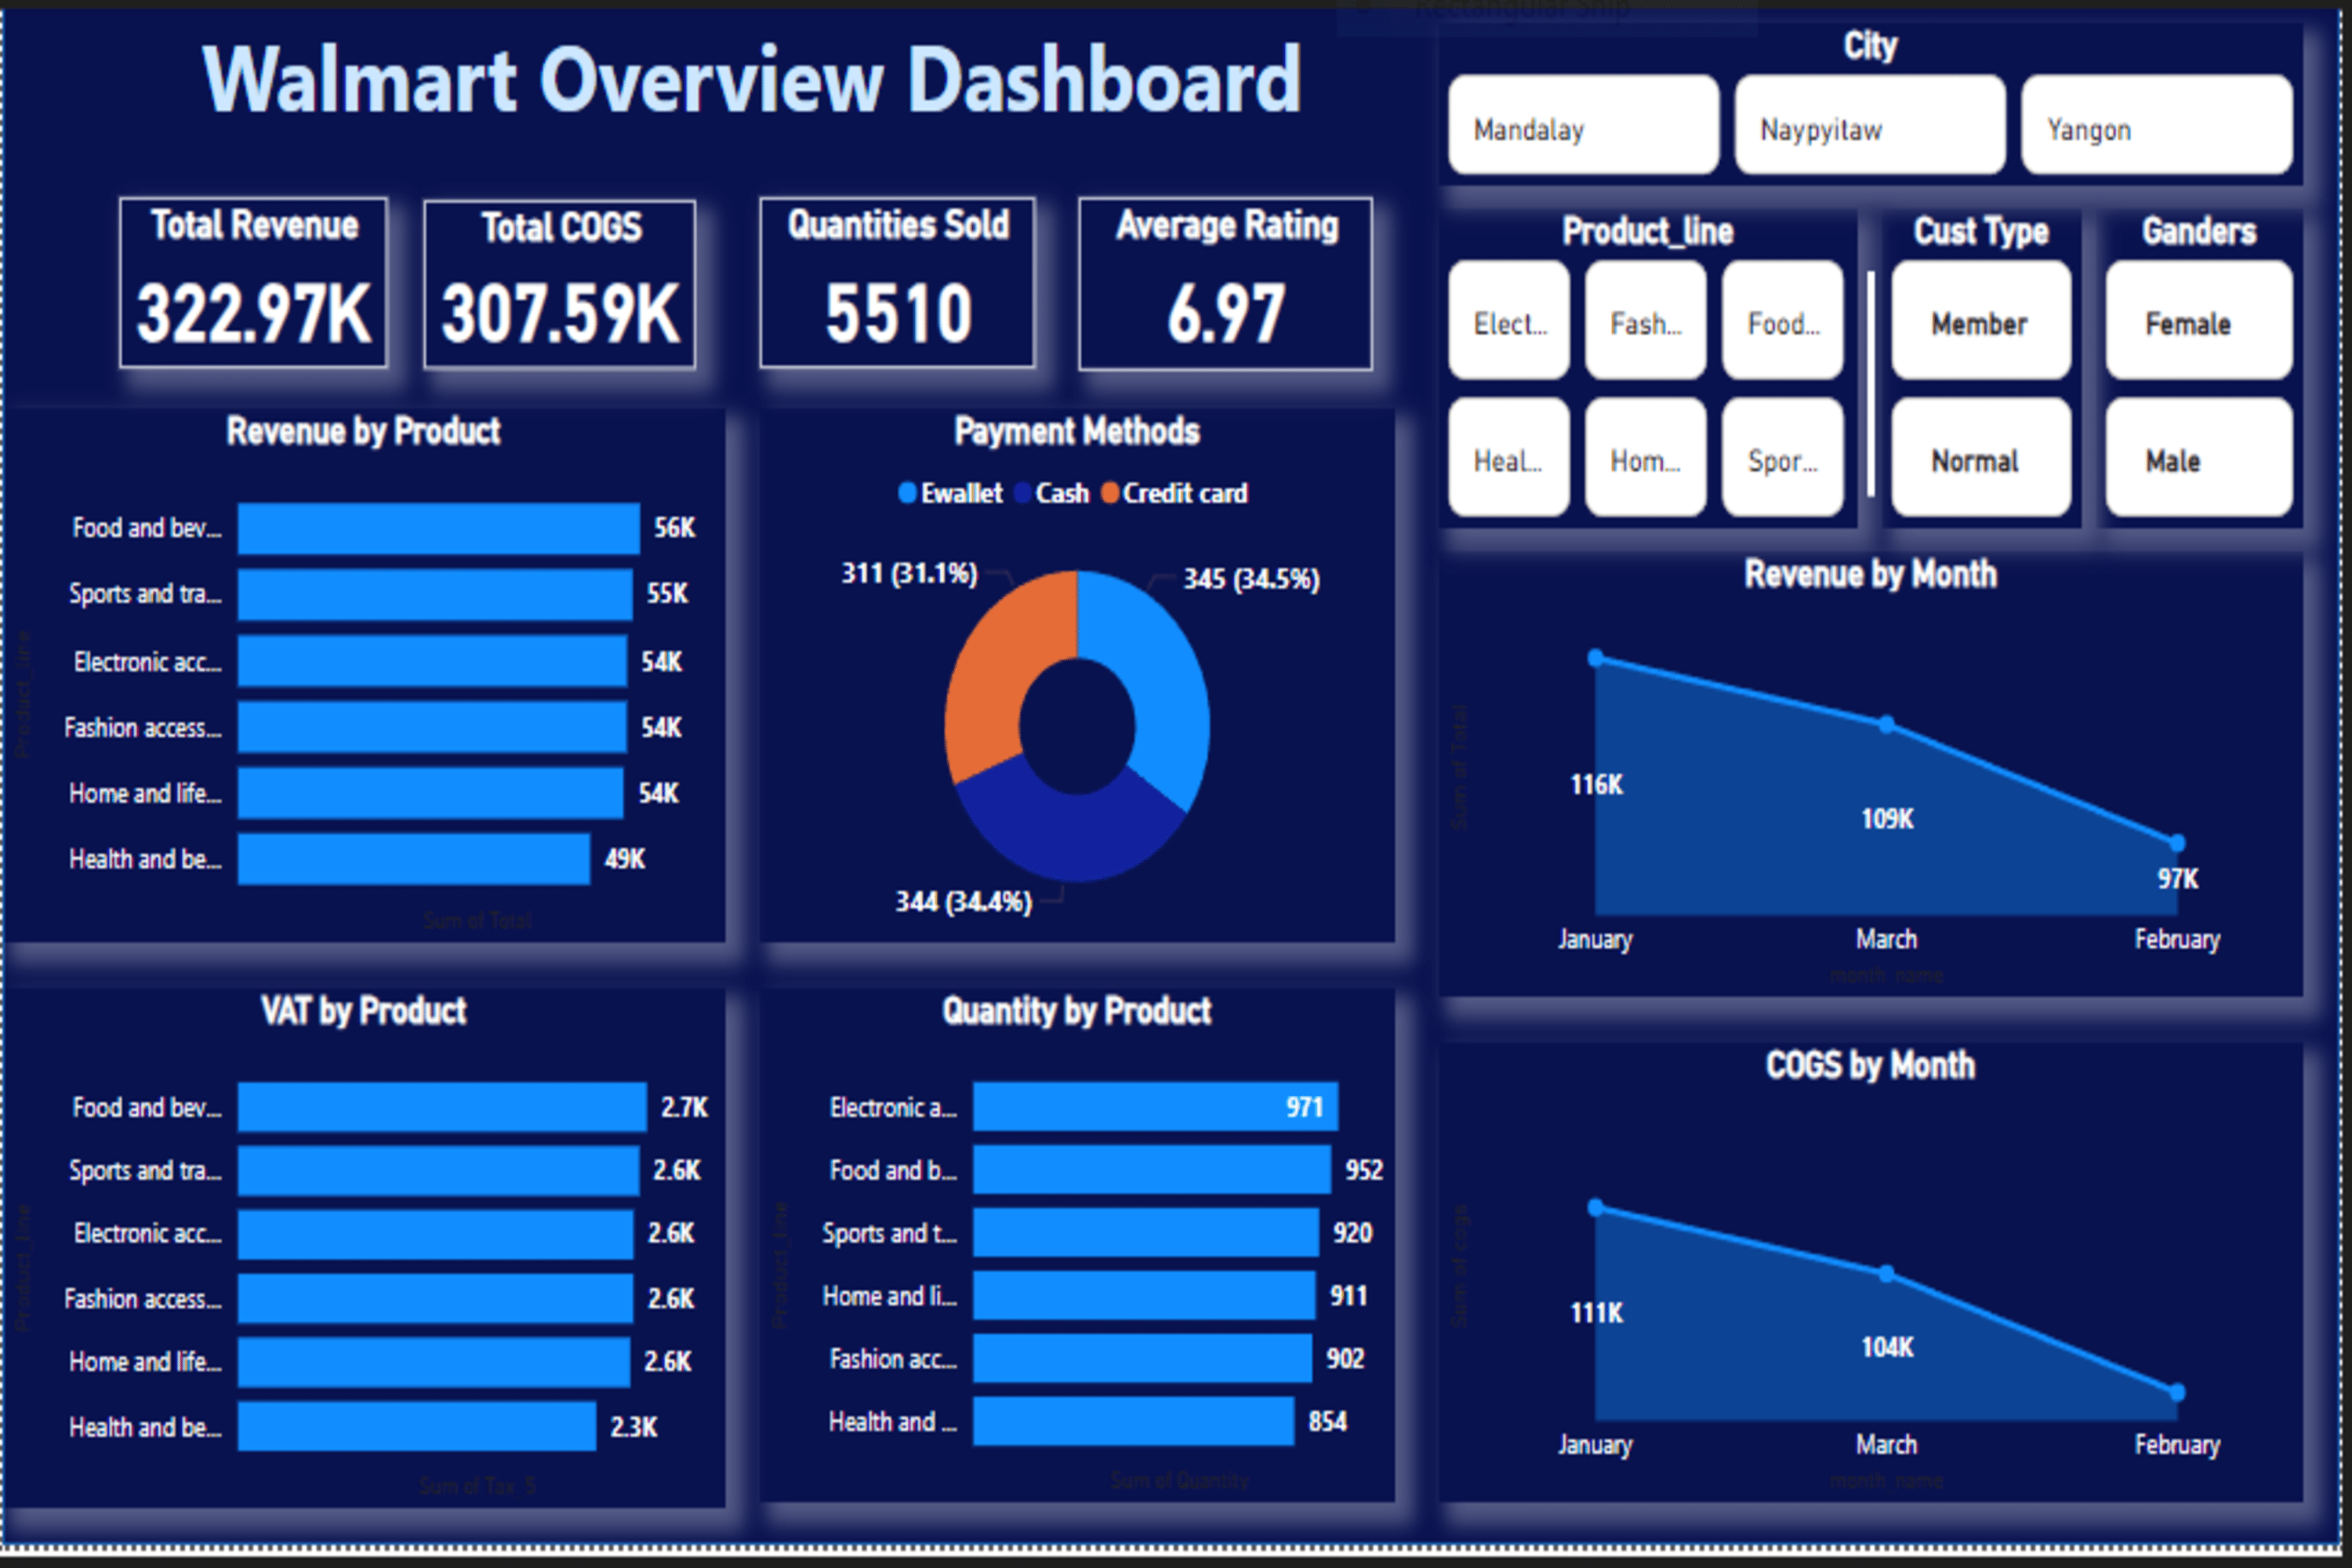
Walmart Data Cleaning, Exploration & Analysis is an end-to-end data analytics project focused on transforming raw retail data into actionable insights. It includes data cleaning, preprocessing, and exploratory data analysis to uncover sales trends, customer behavior, and performance patterns.

SQL Operations on Layoffs Data is a data cleaning and exploratory analysis project focused on global layoff trends. It applies advanced SQL techniques including CTEs, window functions, and data standardization to remove duplicates, handle missing values, and structure data for analysis. Uncovers insights on layoffs by company, industry, and geography.

COVID-19 Data Exploration Project Using SQL is a data analysis project focused on understanding the global impact of the pandemic. Uses SQL for data cleaning, transformation, and exploratory analysis to examine infection rates, death rates, and vaccination progress across countries and continents. Applies advanced SQL techniques like joins, CTEs, and aggregations.
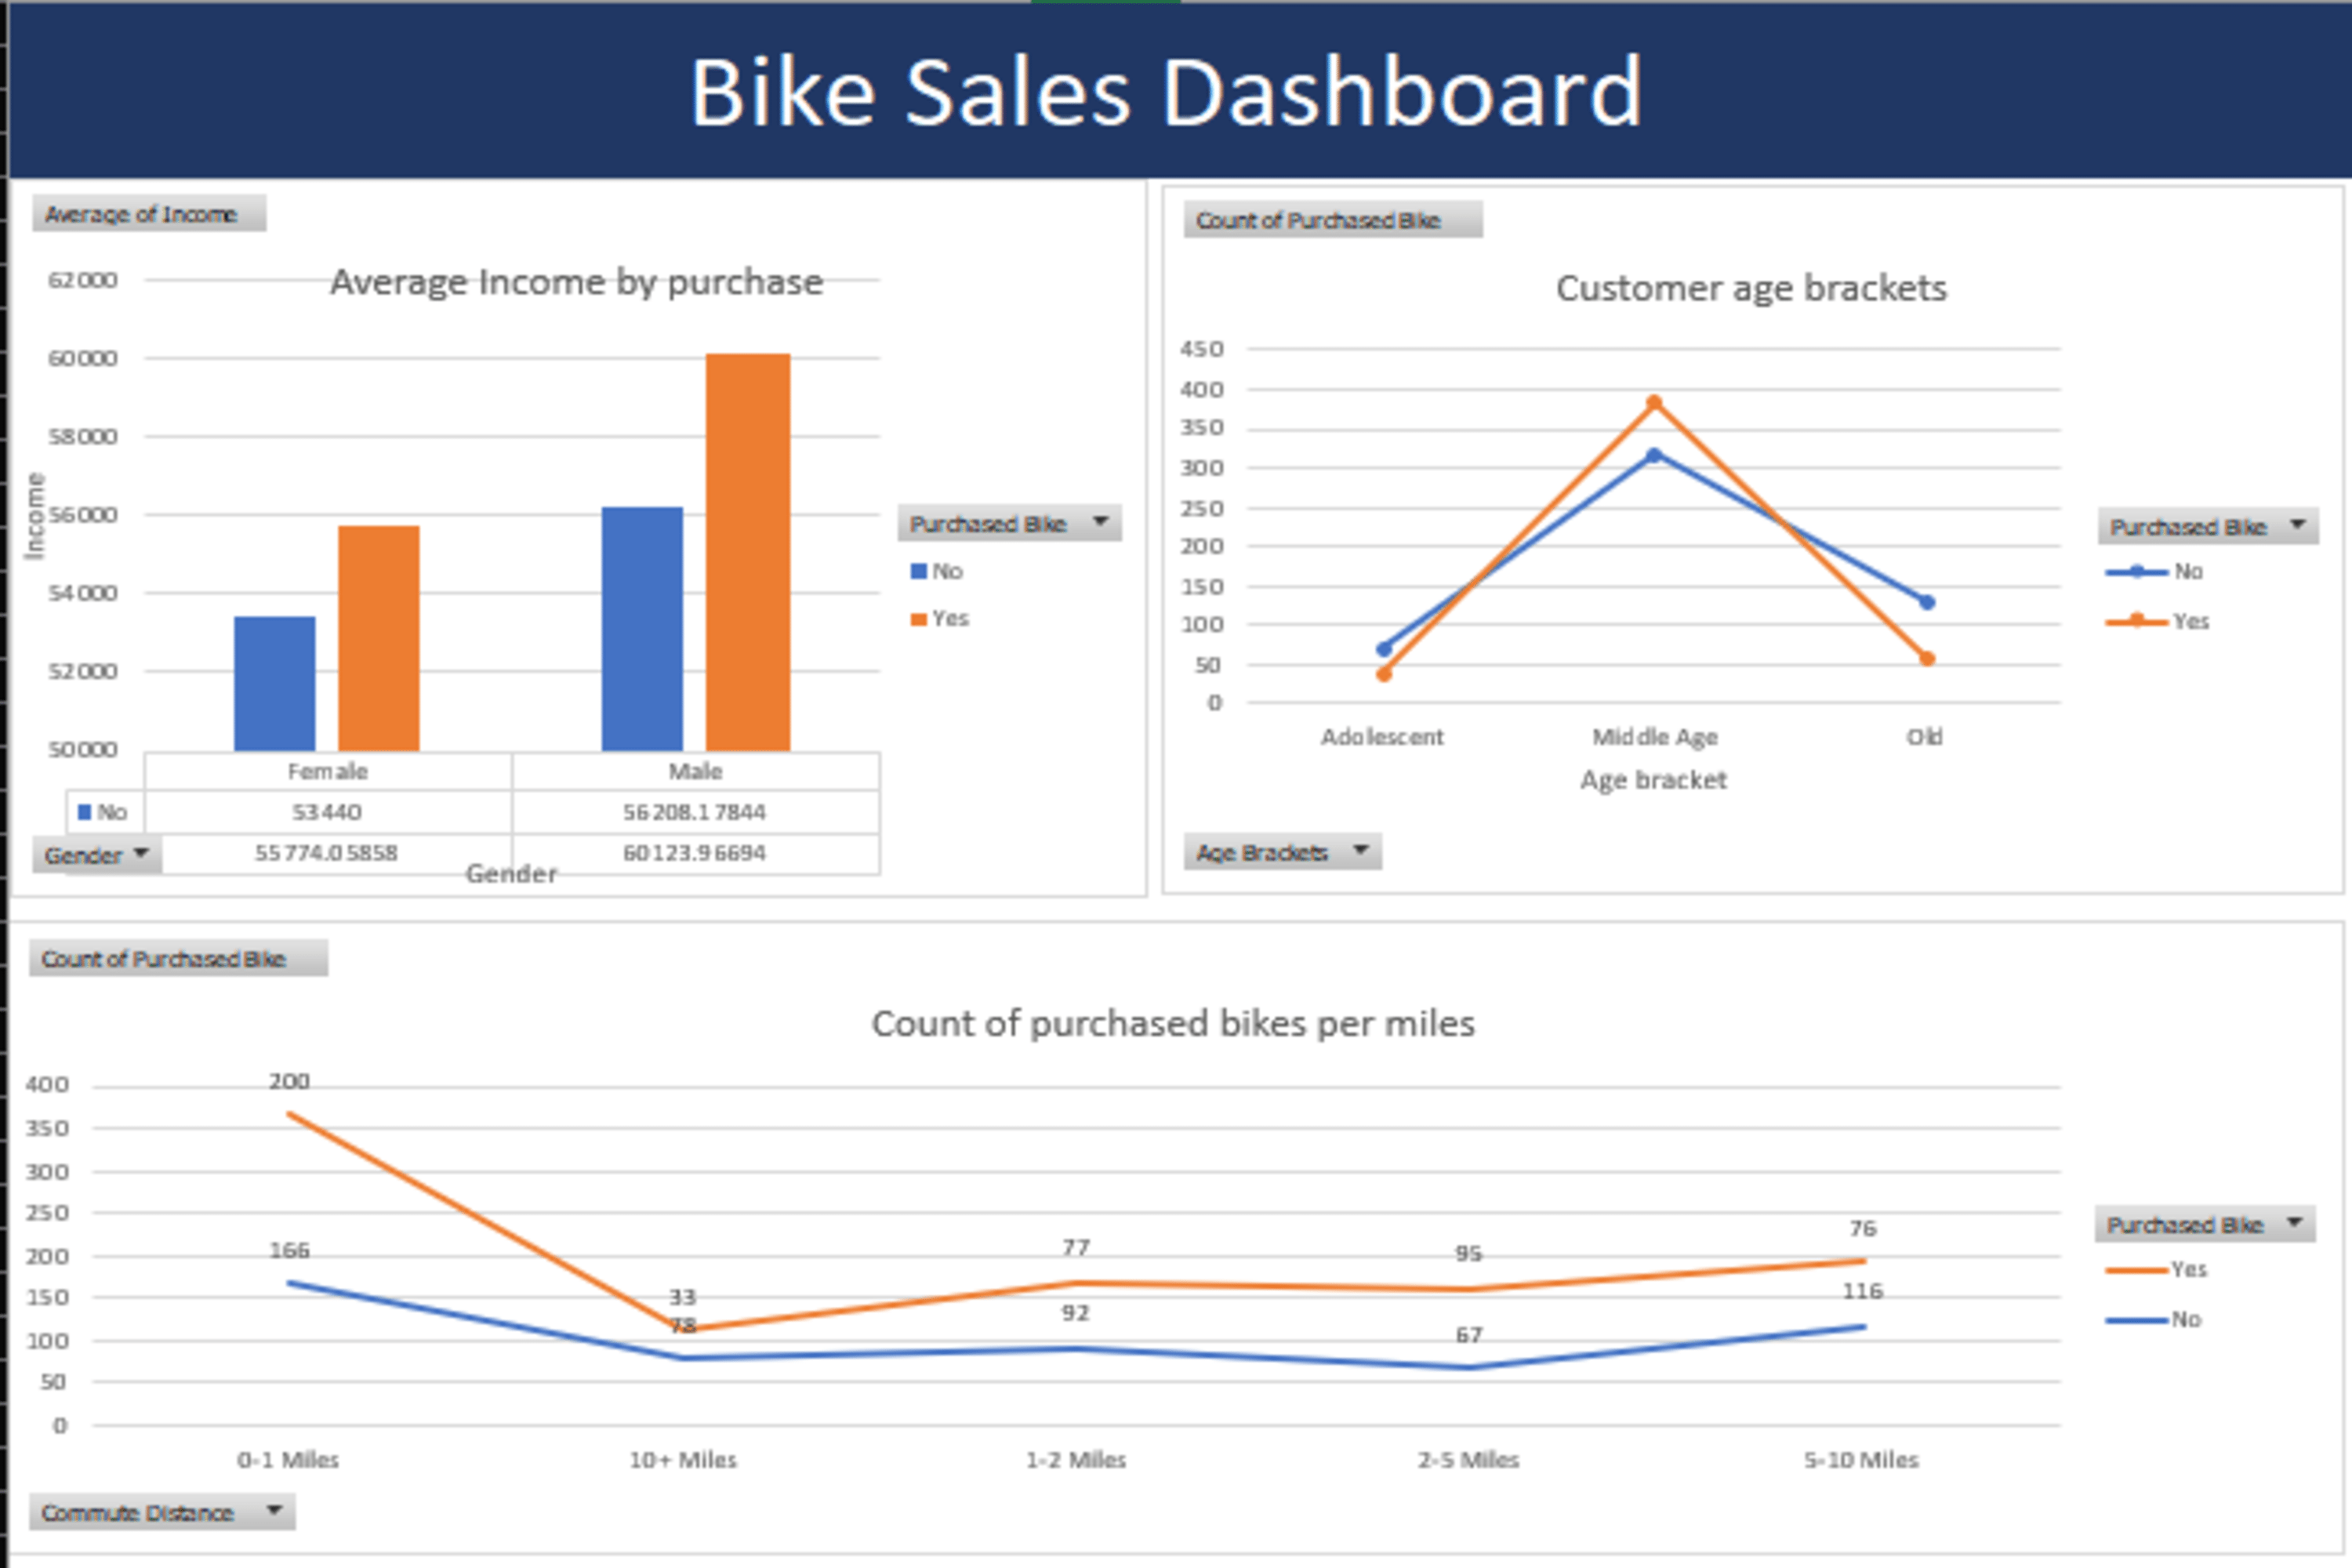
Designed a dynamic Excel dashboard to analyze customer demographics, purchasing patterns, and regional sales performance. Features pivot tables, dynamic charts, and interactive slicers for exploring sales data across multiple dimensions.
Get In Touch